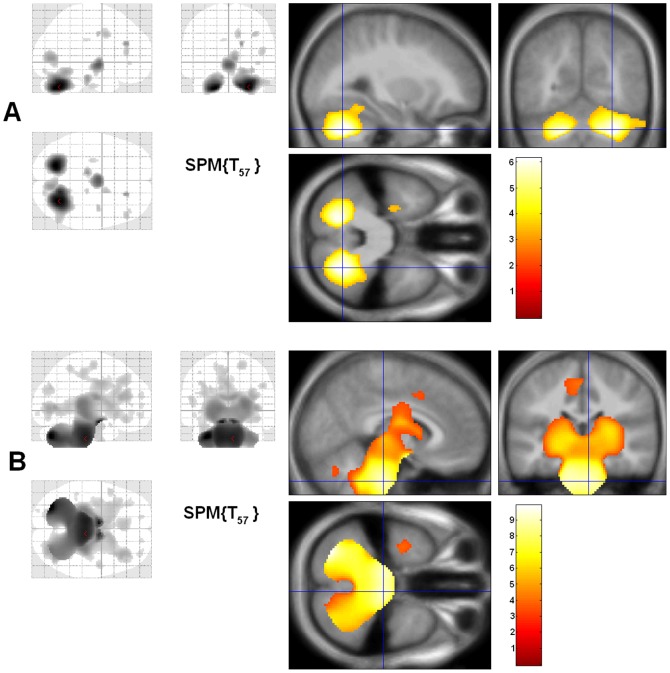
Figure 4. Voxel-based morphometry (VBM) findings.
Gray and white matter clusters where WFS have lower volumes than controls. (A) Gray matter clusters included right cerebellum (p = .0008), and left cerebellum (p = .0125), while (B) white matter clusters included a large cluster consisting of much of the cerebellum, brainstem, and subcortex (p<.001), and a small cluster in the parietal-occiptal cortex (p = .0239). Glass brain (all results shown collapsed on a single slice) view shown on left, and the significant cluster on an average MR overlay is shown on the right. Cross hairs are placed in the voxel with a peak t value in the cluster.

