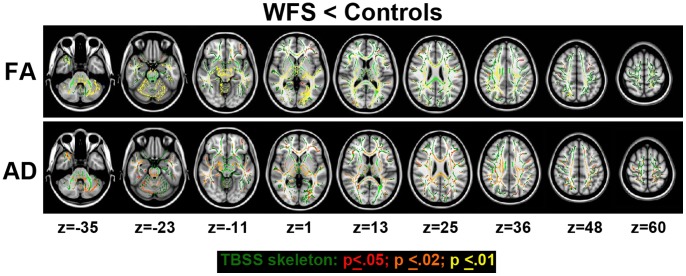
Figure 5. Results from tract-based spatial statistics (TBSS) analysis.
Fractional anisotropy (FA) and axial diffusivity (AD), but not radial diffusivity, were reduced in the WFS group compared to controls (healthy and diabetic control groups combined), even after multiple comparison correction. There were no significant findings in the opposite direction (WFS > controls). White matter tracts in the cerebellum, brainstem, and optic radiations were prominently affected, but changes were also noted in other areas as well. The multiple comparison corrected p values are represented in the color coding. Z = the Talairach coordinate for the transverse plane.

