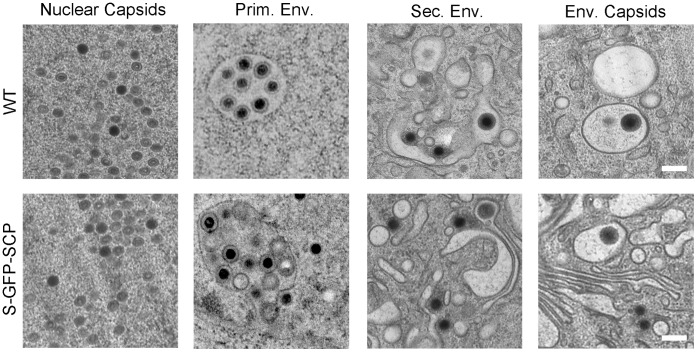
Figure 5. Ultrastructural assessment of S-GFP-SCP infected cells.
NIH-3T3 and M2-10B4 (upper row) or M2-10B4 cells (lower row) were infected at a MOI of 0.5 and centrifugal enhancement with WT (upper row) or S-GFP-SCP labeled virus (lower row) and incubated for 48 h. Afterwards, cells were high-pressure frozen, freeze-substituted, plastic-embedded and thin-sectioned. Depicted are representative details of two independent experiments showing non-enveloped B- and C-capsids in the nucleus (first column), primary envelopment in the nucleus (2nd column), non-enveloped C-capsids near cellular membranes possibly during secondary envelopment (third column), as well as enveloped capsids in the cytoplasm (right column). Scale bars indicate 200 nm.

