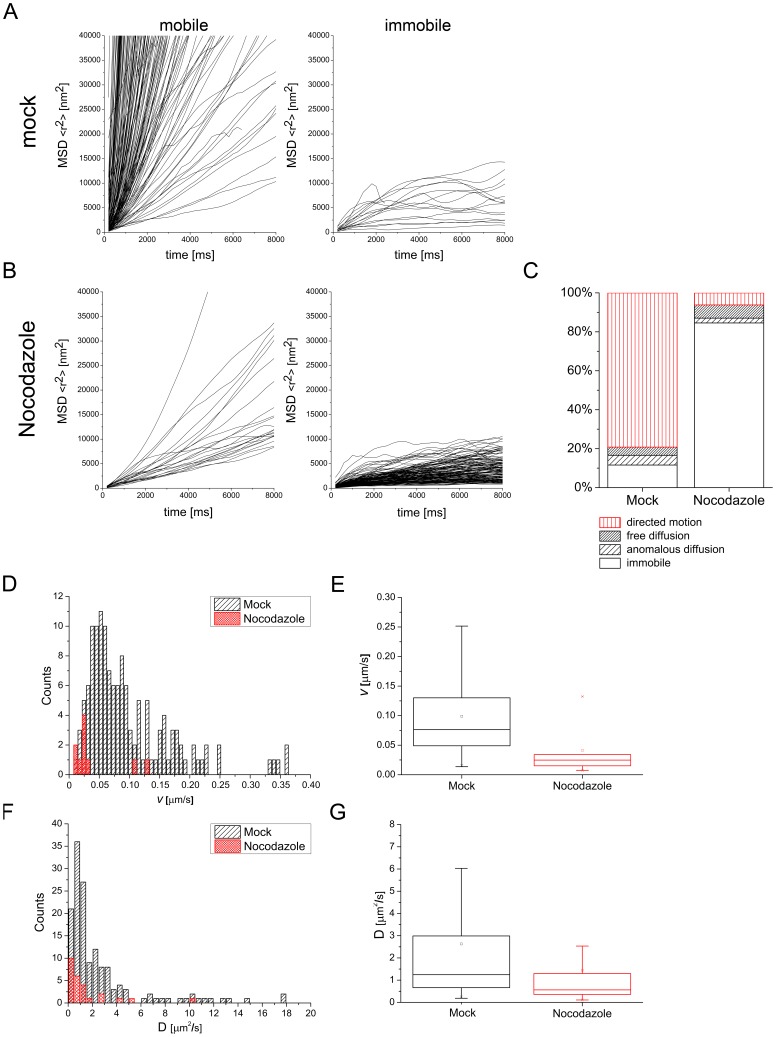
Figure 8. Quantification of particle tracks.
(A) 180 particles from mock treated cells and were tracked and their MSDs plotted against the lag time. Particle tracks were clustered into two classes representing mobile (left diagram) and immobile particles (right diagram) depending on the MSD trend. (B) 163 tracks from Nocodazole treated cells were clustered the same way as in (A). Mobile particles were further clustered depending on which mode of diffusion they exhibited according to their fit to three different diffusion models. (C) Distribution of particle mobility classes for mock- as well as Nocodazole-treated cells depicted in percent. The data is categorized into four classes (immobile, anomalous diffusion, free diffusion, directed motion). (D) Histogram displaying the distribution of mean track velocities of all particles exhibiting directed motion. (E) The same data as in (D) summarized in a box plot with median (line) mean (square), 25th to 75th percentile (box) and whiskers (5th to 95th percentile). (F) Histogram showing the distribution of all measured diffusion coefficients. (G) Box plot of the same data shown in (F).

