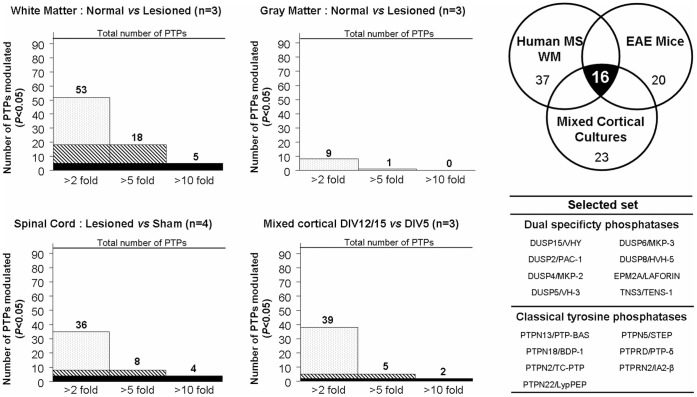
Figure 3. Comparative q-PCR-based differential gene expression and selection of PTPs of interest.
The number of PTPs modulated are indicated for each sample type and classified by fold induction range. A gene is considered as significantly modulated when Pval<0.05. Statistical analysis was performed using one tail student’s t-tests. A Venn diagram was used to represent the 16 PTPs modulated within the three sample types.

