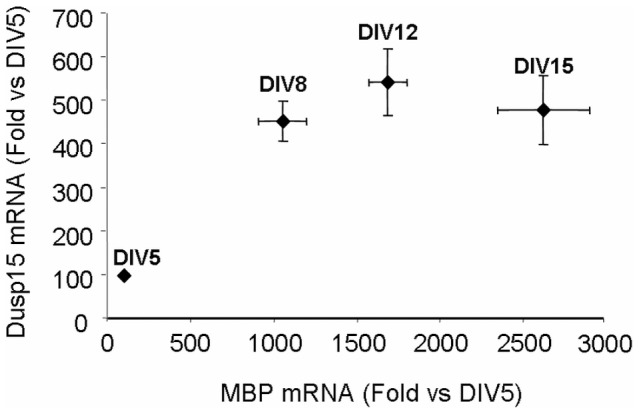
Figure 9. Correlation chart between MBP expression and dusp15 expression over a time course of differentiation in mouse primary cortical cultures.

Values expressed as fold induction versus DIV5 cultures and correspond to the Mean ± SD of two different experiments (n = 3). Dusp15/VHY expression increases with time and correlates with MBP expression until DIV12 then reaches a maximum whereas MBP expression still increases until DIV15.
