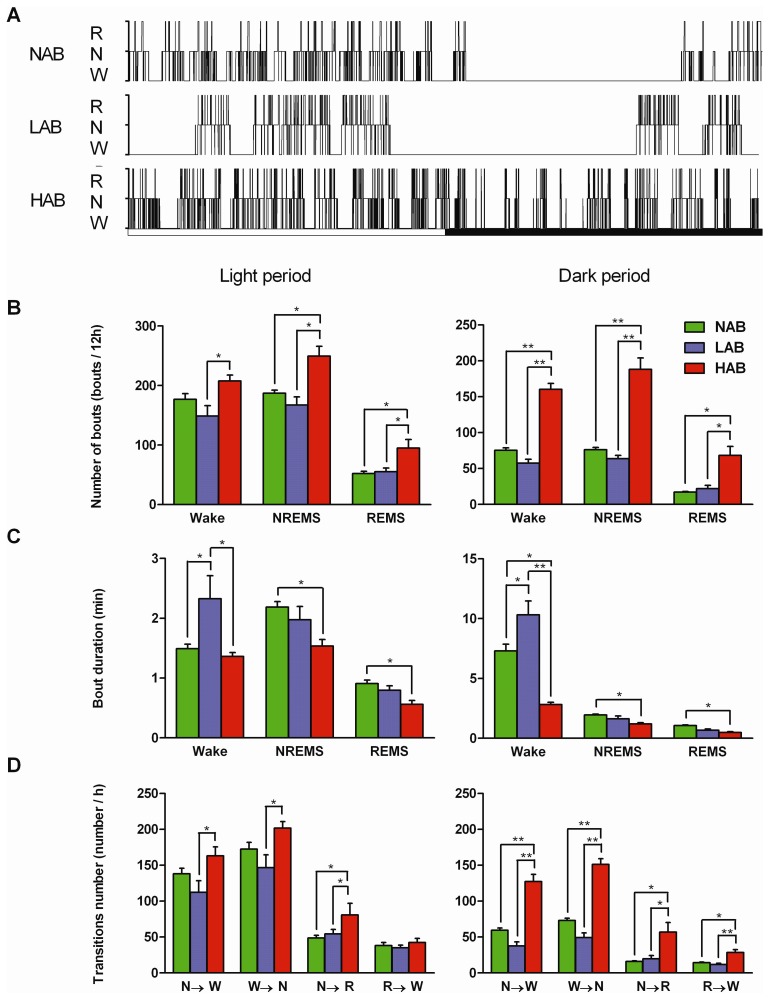
Figure 2. Sleep architecture of the mouse model of trait anxiety.
(A) Representative 24 h hypnograms under baseline conditions of a NAB, LAB, or HAB mouse. The white-black bars below the hypnograms indicate the 12 h light-dark cycle. (W: wakefulness, N: NREM sleep, R: REM sleep) (B – D) Average numbers (B) and durations (C) of wakefulness, NREM sleep (NREMS) and REM sleep (REMS) bouts and state transitions (D) during the 12 h light and dark period. Values are the means ± SEM. NAB (n = 7), LAB (n = 10), and HAB (n = 10). Left and right panels indicate values for the light and dark periods, respectively. *P<0.05, **P<0.001, assessed by one-way ANOVA with the factor ‘line’ followed by Bonferroni's test.

