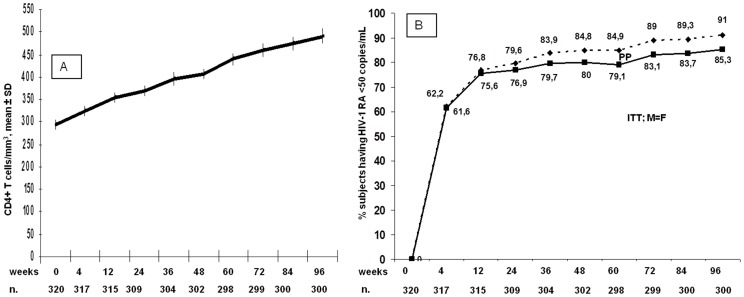
Figure 1. CD4+ T cells/mmc slope over 96 weeks and proportion of subjects achieving and maintaining optimal viral suppression, set for homogeneity at <50 copies/mL.
The dimensions of the population at each timepoint is reported below (n). In figure 1A values are presented as mean±standard deviation (SD). In figure 1B the spotted line presents data in the on treatment analysis, while the continuous line shows the intention-to-treat, missing data = failure analysis (ITT; M = F).

