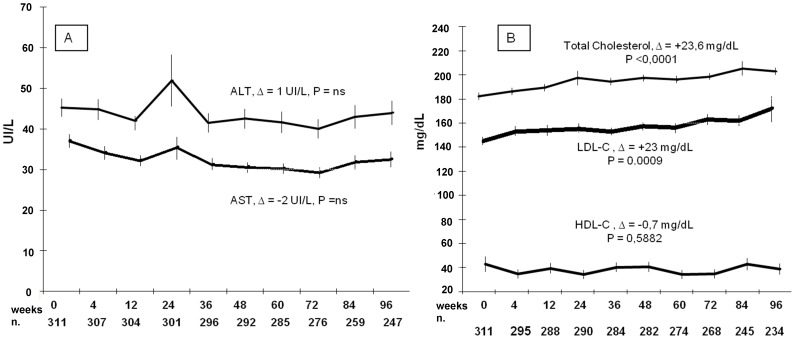
Figure 2. Metabolic impact of raltegravir-based salvage salvage regimens over 96 weeks.
In both figures values are presented as mean±standard deviation (SD). The dimension of the cohort at each timepoint is reported below (n.). (2A) AST and ALT slope over 96 weeks, all data caught (even 1 acute hepatitis B), (2B) total and fractionated cholesterol slope.

