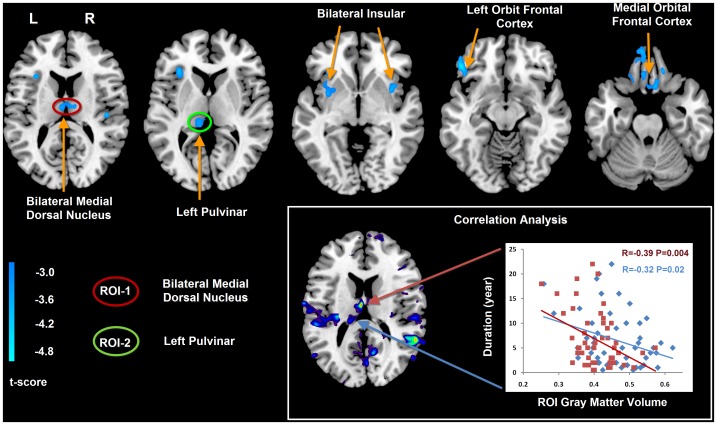
Figure 1. Gray matter difference between IGE-GTCS and healthy controls, and correlation analysis between gray matter volume and epilepsy duration.
The cold color denotes the brain regions having reduced gray matter volume in IGE-GTCS patients. Maps threshold were set at P<0.01, with AlphaSim correction. According to this VBM comparison results, the bilateral medial dorsal nuclei (Red circle) and the left pulvinar (Green circle) were defined as ROIs for the subsequent functional connectivity analyses. In addition, the left medial dorsal nuclei and pulvinar showed negative correlation between gray matter volume and epilepsy duration. The red block represent the gray matter volume of IGE-GTCS patients in left medial dorsal nucleus (R = −0.39, P = 0.004), the blue rhomboid represent the gray matter volume of IGE-GTCS patients in left pulvinar (R = −0.32, P = 0.02).

