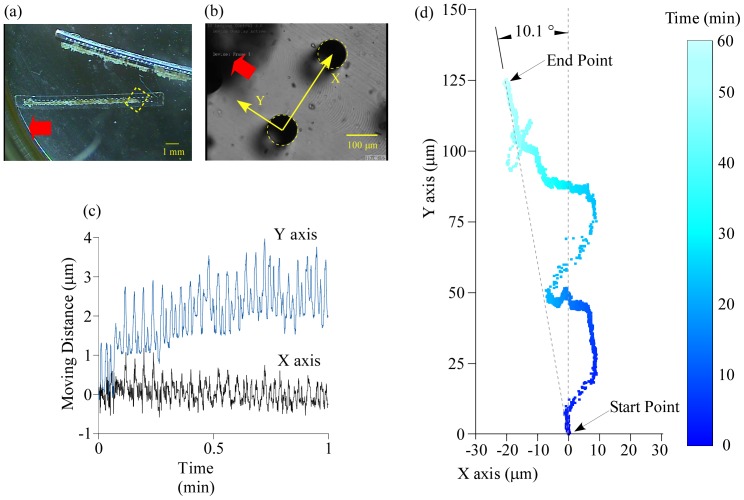
Figure 3. Trajectory measurement of the prototype PMR powered by contraction force of the dorsal vessel tissue.
(a) An image of the whole prototype after inversion. (b) Enlarged view of the area surrounded by the dotted rectangle marked in (a). A movie of this area was taken for 60 min (Movie S5 in the SI) and used for image analysis. The moving direction was set as the Y axis and the axis perpendicular to the Y axis was set as the X axis. In (a) and (b), the red arrows show the designed moving direction. (c) Time courses of moving distances along X and Y axes for 1 min. (d) Trajectory of the prototype for 60 min. Time is expressed as gray scale (intensity of blue in the online version). The moving distance from the start point to the end point was 125.5 µm.

