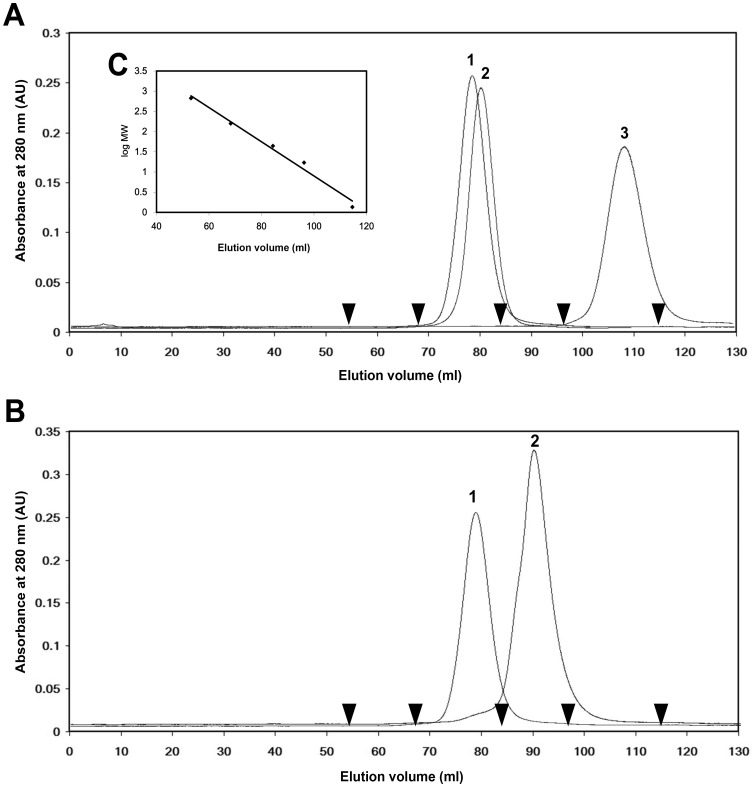
Figure 4. Determination of tetrameric IPO by gel-filtration chromatography.
The HiLoad™ 16/60 Superdex™ 200 column was pre-equilibrated with a running buffer containing 27 mM Tris-HCl (pH 7.0) and 2 M NaCl with and without 0.2 M Me-Glc or 1 M glucose at a flow rate of 0.6 ml/min. The elution profiles were monitored at 280 nm. (A) Peak 3 represents the IPO protein dissolved in the running buffer without carbohydrates and eluted at 108.2 ml. Peak 2 represents the IPO protein dissolved in the running buffer with 0.2 M Me-Glc and eluted at 80.5 ml. Peak 1 represents the IPO protein dissolved in running buffer with 1 M glucose and eluted at 78.8 ml. The retarded results from peaks 1 and 2 show that the IPO protein could bind to the dextran of the Superdex 200 column. The retarded phenomenon of IPO could be complemented by 1 M glucose. Peak 3 was found with an estimated molecular mass of 63.2 kDa corresponding to a tetramer with 69.2 kDa. (B) To determine the role of the N terminus of IPO protein in tetramerization, a truncated IPO by removing residues 1 to 10 was prepared. The proteins were dissolved in the running buffer with 1 M glucose. Peak 1 represents the native IPO and was eluted at 78.8 ml. Peak 2 represents the truncated IPO and was eluted at 89.6 ml. Peak 2 was calculated with a molecular mass of 22.0 kDa corresponding to a truncated monomer with 16.3 kDa. (C) The standard markers from BioRad containing thyroglobulin (670 kDa), gamma-globulin (158 kDa), ovalbumin (44 kDa), myoglobin (17 kDa), and vitamin B12 (1.35 kDa) were used to calculate the equation of linear regression. The X-axis represents the elution volume and Y-axis the log value of molecular mass from the standard markers. The equation is y = -0.0423x+5.1333 and R2 = 0.9847.

