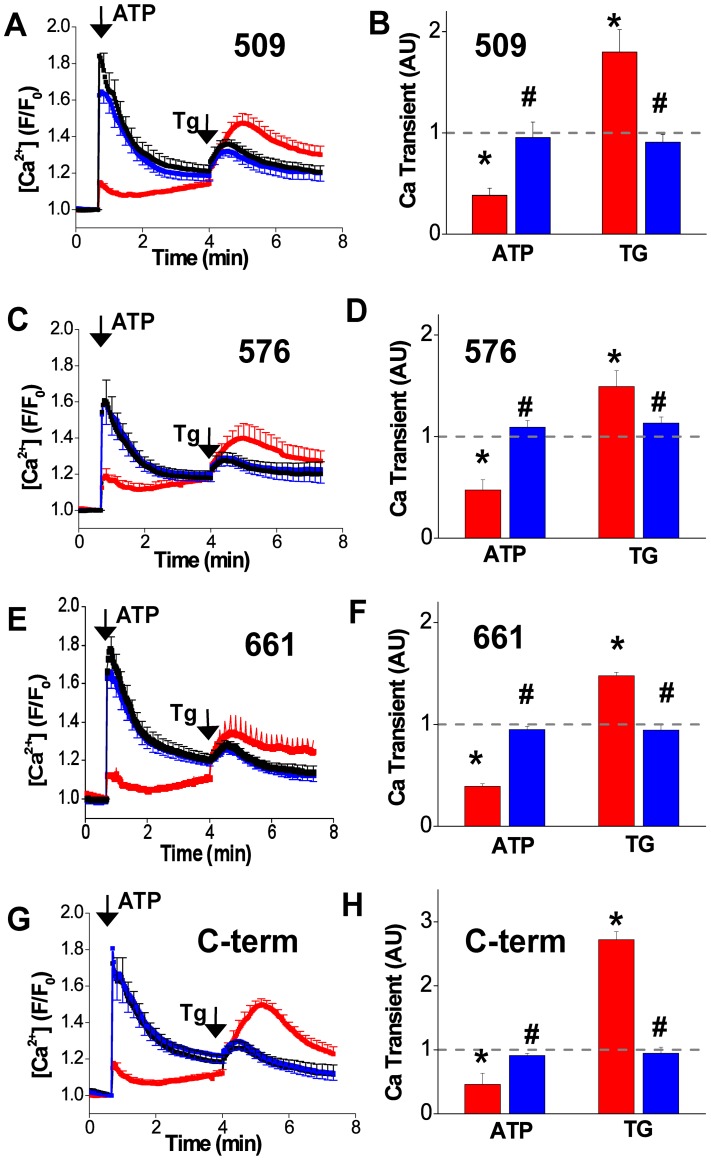
Figure 3. Ca uptake in live cells quantified from changes in cytosolic Ca measured by X-rhod 1 fluorescence.
Application of extracellular ATP elicited an increase in cytosolic Ca in untransfected cells (black). This Ca transient was largely abolished in cells in the same microscopic field that expressed 2-color SERCA constructs (red), suggesting Ca uptake by 2-color SERCA. Coexpression of PLB partially restored the ATP-releasable Ca transient, consistent with inhibition of 2-color SERCA by PLB. The Ca content of the ER was evaluated by application of 10 µM Tg. Cells expressing 2-color SERCA (red) had a larger Tg-releasable ER content compared to untransfected cells (black). This difference was abolished by coexpression of PLB (blue). A. Uptake of Ca by 509. B. Summary of 509 uptake (normalized area under the peak). C. 576. D. Summary of 576. E. 661. F. Summary of 661. G. C-term. H. Summary of C-term. * indicates 2-color SERCA was significantly different from paired control (untransfected cells). # indicates 2-color SERCA + PLB was significantly different from unpaired 2-color SERCA alone.

