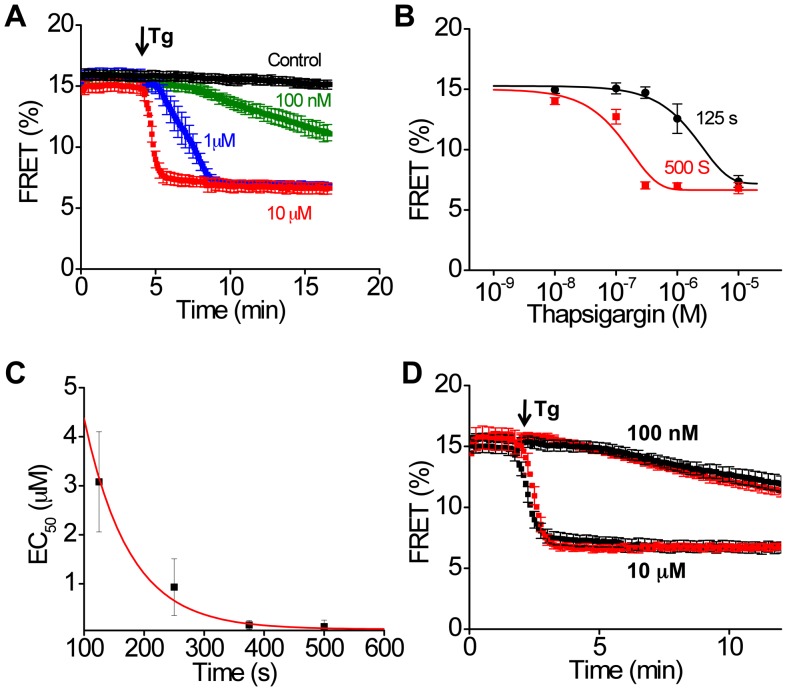
Figure 8. Tg-dependent conformational changes of 2-color SERCA (construct 509).
A. The rate of change of FRET was Tg concentration dependent. B. Tg titration of 2-color SERCA, measured at different time points. C. The time dependent shift in apparent affinity of SERCA for Tg. D. The rate of Tg binding was not changed by coexpression of PLB with 2-color SERCA (red) compared to 2-color SERCA alone (black).

