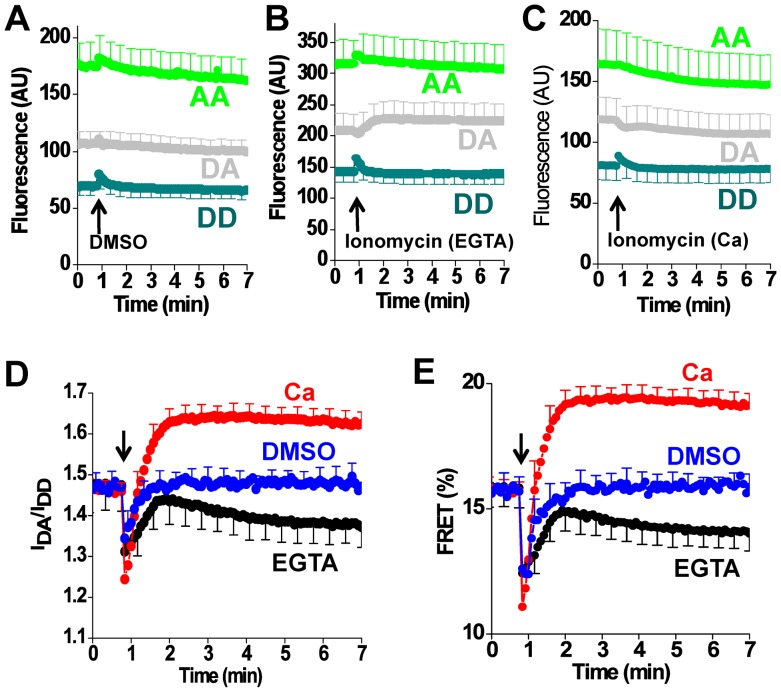
Figure 9. Ca2+-dependent conformational changes of 2-color SERCA (construct 509).
A. Fluorescence emission measured in the donor channel (DD) and acceptor channel (AA), and the acceptor emission with donor excitation (DA) after the addition of DMSO vehicle. B. Fluorescence emission after addition of ionomycin in 2 mM Ca. C. Fluorescence emission after addition of ionomycin in the presence of EGTA. D. The ratio of DA and DD fluorescence intensities suggest that FRET is increased with Ca (red), and decreased with EGTA (black) compared to DMSO vehicle (blue). E. The corresponding FRET efficiency calculated according to the E-FRET method.

