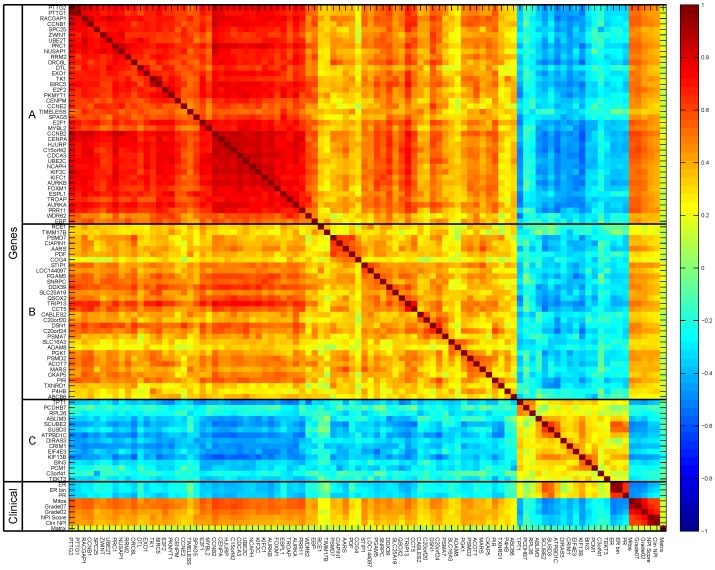
Figure 7. Heatmap showing the Pearson correlation of the 87 genes, and nine clinical features used by the ‘NMC; Late OR’ classifier.
On the left, the genes and clinical parameters are indicated, along with three subgroups of genes (labeled A, B, and C), that form the main clusters of genes. The color in the heatmap scales with the correlation of a particular pair of features, and ranges from -1 (blue) to 1 (red).

