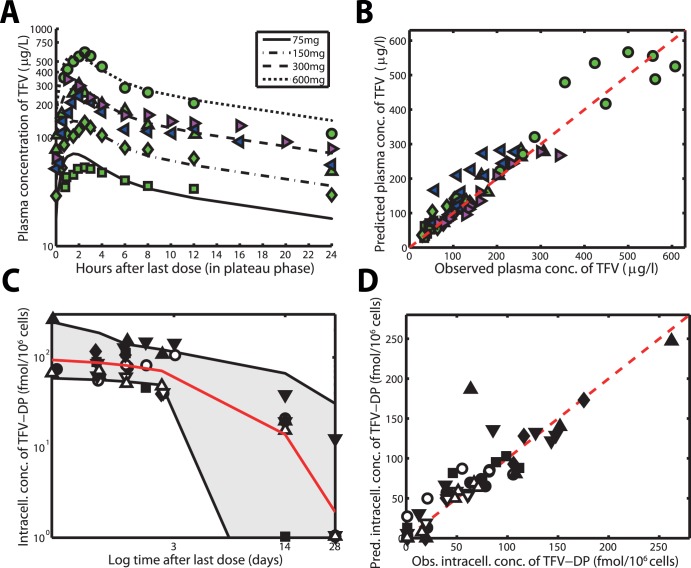
Figure 2. Pharmacokinetics of TFV for different doses of oral TDF at plateau and intracellular TFV-DP concentrations after treatment cessation.
A: Predicted pharmacokinetics of TFV after once daily 75-, 150-, 300- and 600 mg oral TDF (lines) together with data from [7], [9], [12] (markers). B: Goodness-of-fit plot for the plasma pharmacokinetics of TFV with data from 3 clinical studies and 4 different dosing schemes [7], [9], [12]. The dashed red line indicates the line of unity, whereas the green squares, -diamonds, triangles and filled dots represent the observed TFV concentrations in [12] following 75-, 150-, 300- or 600 mg once daily administration of TDF. The blue left-pointing triangles and the magenta right-pointing triangles represent observed TFV concentrations after 300 mg once daily oral administration from [9] and [7] respectively. C: Predicted pharmacokinetics of intracellular TFV-DP after stopping of 300 mg once daily oral TDF dosing (lines) together with data from [11] (markers). D: Goodness-of-fit plot for intracellular TFV-DP. The up- and downward pointing filled and open triangles, open- and filled circles, filled squares and filled diamonds indicate intracellular TFV-DP pharmacokinetics after stopping 300 mg once daily oral TDF dosing in 8 different individuals from [11].

