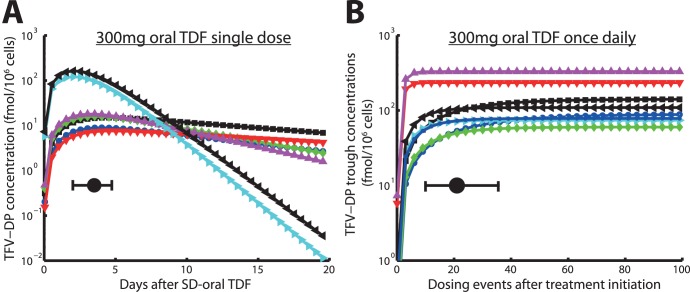
Figure 3. Predicted TFV-DP intracellular pharmacokinetics following a single dose oral 300 mg TDF and accumulation of TFV-DP after daily 300 mg oral TDF.
A: Predicted intracellular pharmacokinetics of TFV-DP in PBMCs after a single 300 mg oral TDF dose. Solid black circle and horizontal error bar indicate the  value and its range. B: Trough levels of TFV-DP in PBMCs following 300 mg oral TDF every 24hours, indicating the accumulation of active compound. The solid black circle and the horizontal error bar indicate the time until plateau concentrations are reached and the range for this parameter. Blue cirles, black squares, green diamonds, red downward pointing triangles, magenta upward-pointing triangles, cyan right-ward pointing triangles, black left-pointing triangles and blue asterisks indicate individual predictions for 8 patients.

