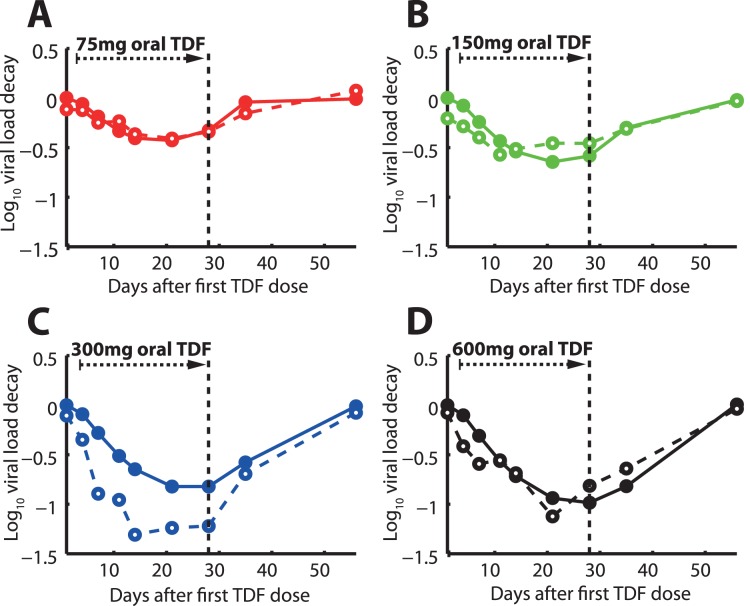
Figure 4. Viral load log10 kinetics during- and after 28 days of TDF mono-therapy.
Black dashed vertical lines indicate the withdrawal of TDF dosing. Solid lines represent predicted median viral kinetics using the coupled PK-PD model, whereas dashed lines represent the observed viral kinetics [12]. Once daily 75mg TDF dosing. B: Once daily 150 mg TDF dosing. C: Once daily 300 mg TDF dosing. D: Once daily 600 mg TDF dosing.

