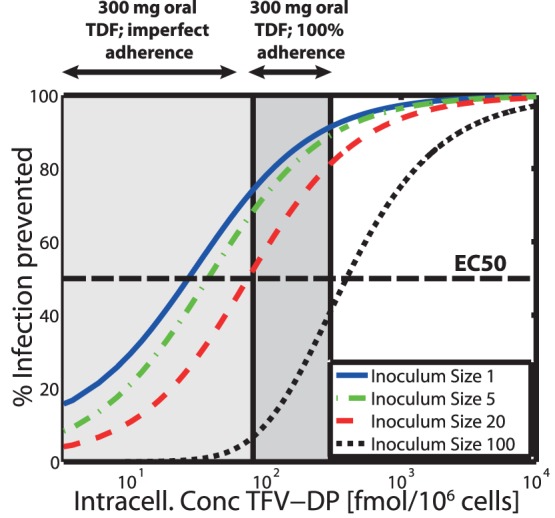
Figure 6. Predicted % infections prevented vs. intracellular TFV-DP concentrations for distinct virus inoculum sizes.

The solid blue-, dash-dotted green, dashed red and dotted black lines show the concentration-response profile for virus inoculum size 1, 5, 20 and 100 respectively. The thick dashed horizontal black line indicates the TFV-DP concentration, which prevents 50% of infections ( ). The dark grey area indicates the TFV-DP concentration range achieved during once daily 300 mg oral TDF dosing with 100% adherence, whereas the light grey extension to the left indicates the range of concentrations resulting from imperfect adherence. Predictions are based on the approximate analytic solution derived in Text S2.
