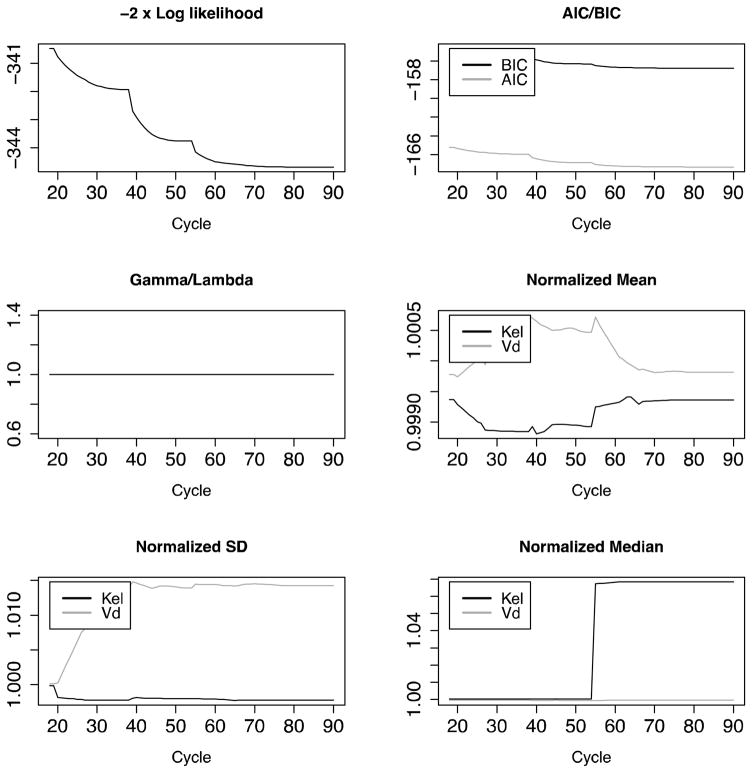
Figure 1.
Standard Pmetrics cycle plot for NPAG to evaluate convergence. By default, the first 20% of the total cycle number are omitted from the plots to magnify the final cycles. All plots should approach a constant slope of 0 as convergence occurs. In this simulated example, there is no additional noise beyond assay noise, so gamma is one in all cycles.

