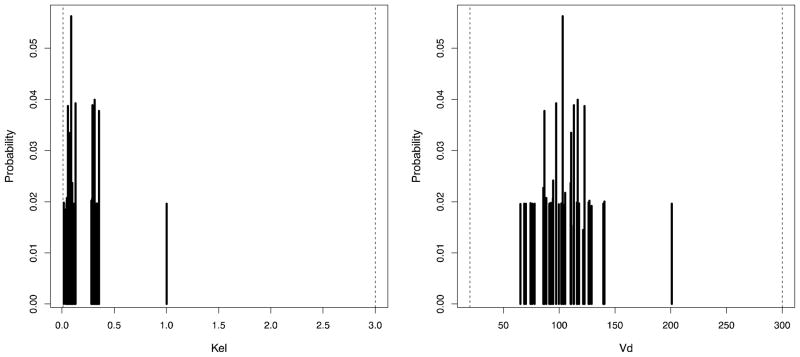
Figure 4.
Standard Pmetrics marginal plot for Kel and Vd from final cycle population values estimated by NPAG. Dashed lines at the margins are the original ranges for each parameter specified for the run. The outlier is clearly visible at Kel=1.0 and Vd=200, as well as the bimodal distribution for Kel and unimodal distribution for Vd.

