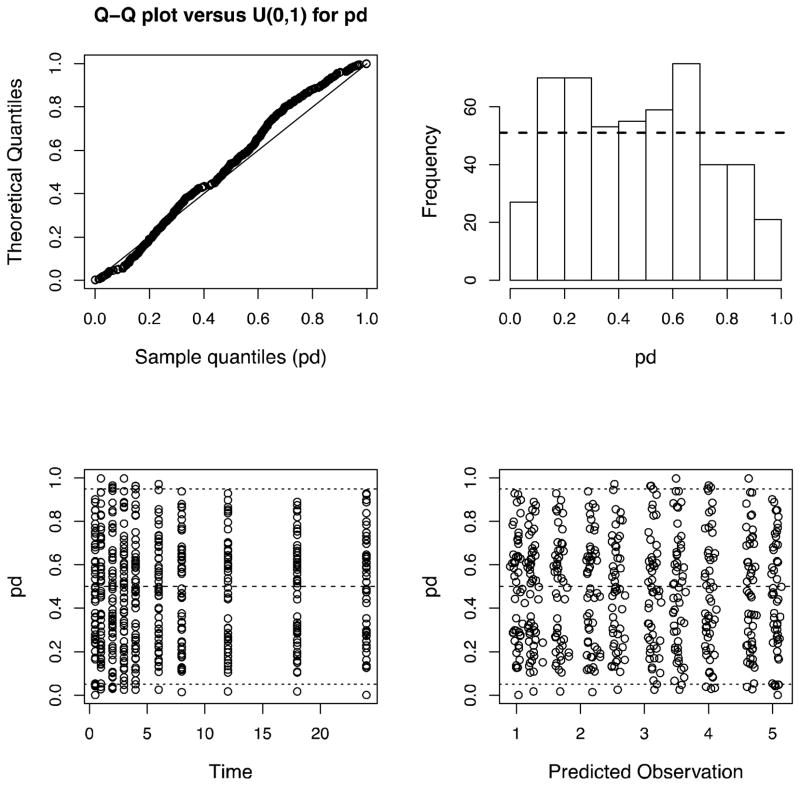
Figure 7.
Standard Pmetrics plot of prediction discrepancies (or standardized visual predictive check) for internal model validation using the simulator embedded within the PMdiag function and a multi-modal, multi-variate prior distribution of parameter values from the non-parametric population model, as described in the text. Expected distributions in the normal Q-Q plot (upper left) and histogram (upper right) are indicated by the reference lines. Distributions on the lower plots should ideally be evenly distributed between 0 and 1, with the 5th, 50th (median) and 95th percentiles indicated by the reference lines. As expected from simulated data, the results in this figure show a very good model fit.

