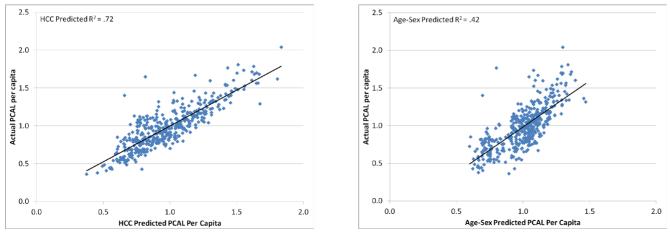
FIGURE 2.
Predicted vs. Actual PCP-level Average Per Capita PCALPractice Spending
A. HCC-Predicted versus Actual PCAL
B. Age-sex Predicted versus Actual PCAL
Notes: PCP: primary care provider; PCAL: primary care activity level; HCC: hierarchical condition categories. For each of 436 PCPs, plotted values are person -year averages for those assigned to the practice. On the horizontal axis are 2007 PCAL predictions, converted to a relative cost by dividing by the sample mean. Vertical -axis values are defined analogously for actual PCAL outcome values (called in the text), also normalized to 1. Figure 2A uses predictions for Y from the HCC model; Figure 2B uses predictions from an age-sex model.

