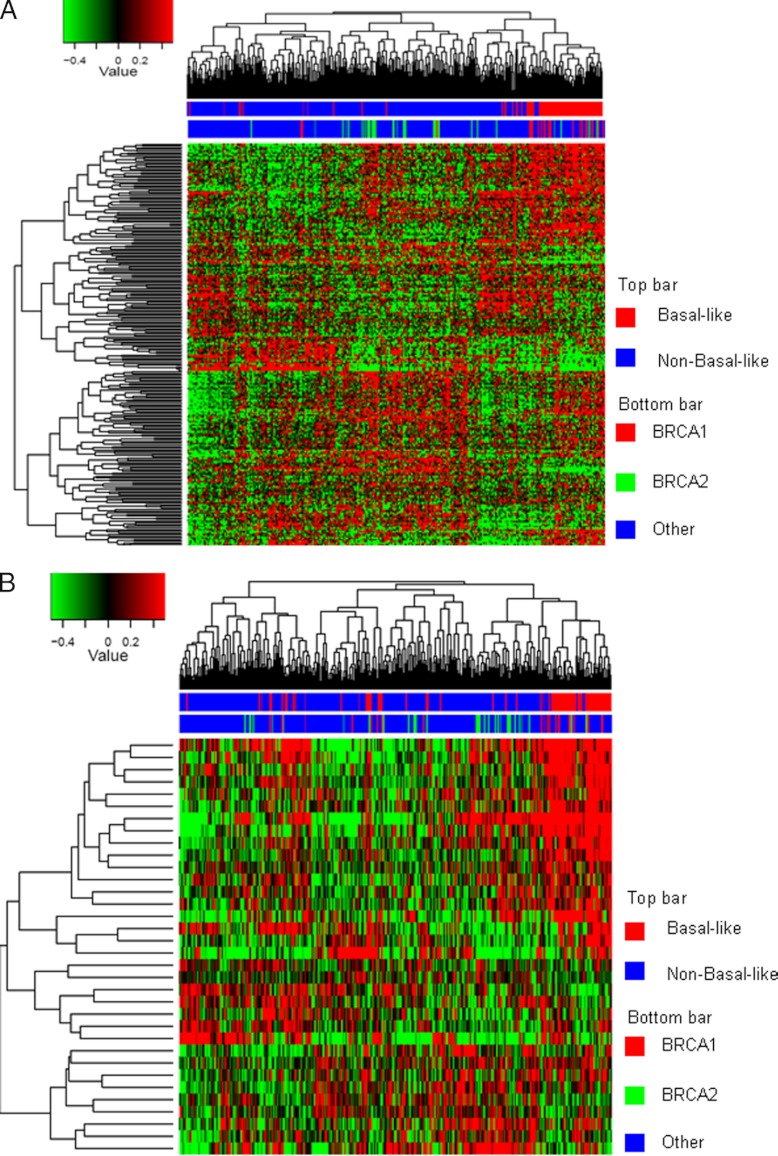
Fig. 4.
Hierarchical clustering of proteins mapped to gene transcripts for the Jönsson data set. A, cluster analysis using the 417 up-regulated mapped proteins. The majority of the BRCA1 patients cluster together within the basal cluster in one branch of the dendrogram. The adjacent cluster contains the majority of the BRCA2 patients. B, cluster analysis using the 45-protein BRCA1 deficiency signature. The BRCA1 and BRCA2 samples are now adjacent to each other in one cluster containing approximately one-third of all patients.

