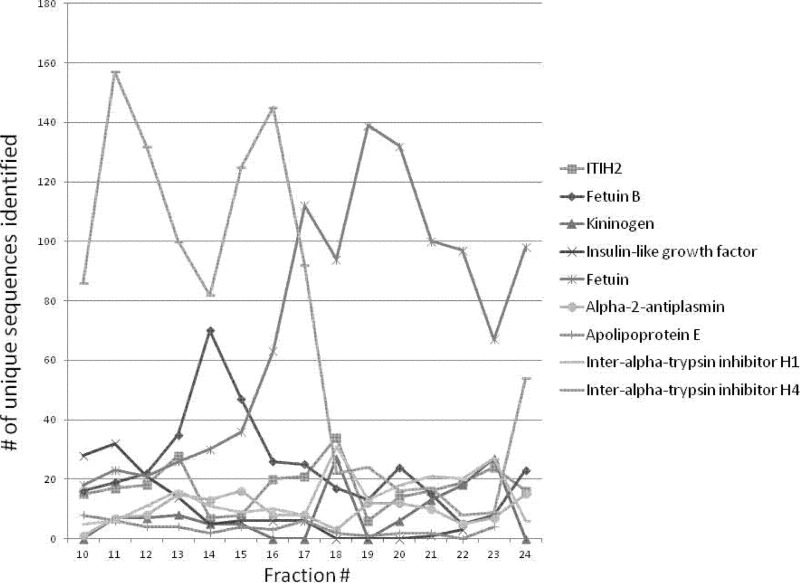
Fig. 2.
Distribution of glycopeptides from nine abundant proteins in the mixed-bed ion exchange separation fractions. Different site assignments count as unique. The x-axis in represents the elution time: 2 min fractions were collected. (The color version of this Fig. can be seen in supplemental Table S3.) In order to illustrate the complexity of the system more liberal acceptance criteria were applied for the data used in this Figure: discriminative score ≥ 0; peptide score ≥15; E ≤ 0.1; mass error ≤ 10 ppm.

