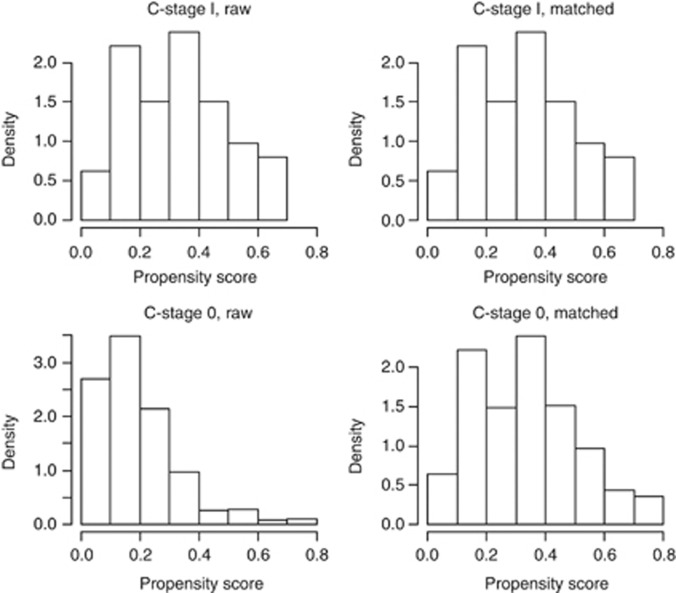
Figure 4.
Distribution of propensity score before and after propensity score analysis. Left upper and lower panel show the distribution of the propensity score for patients with C1-stage and C0-stage before the matching procedure. Right upper and lower panel demonstrate the distribution of the propensity score after full propensity score matching.

