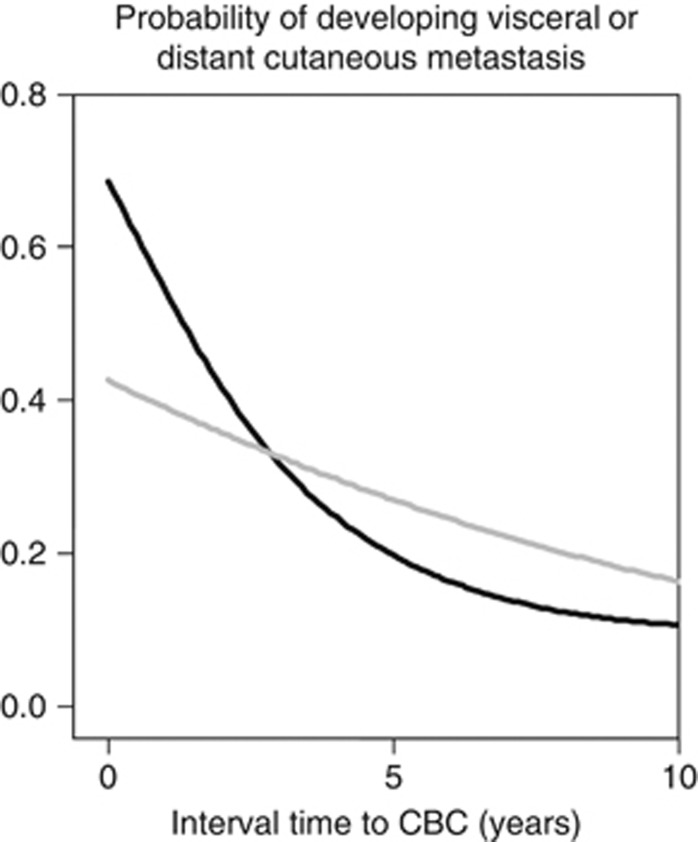
Figure 2.
Five-year probabilities of developing visceral or distant cutaneous metastasis after the diagnosis of CBC are plotted against interval time to CBC. The gray curve shows the probability estimated from a competing risk regression, based on a linear relationship between the probability and the interval time. The black curve shows the probability using a cubic spline relationship with three knots.

