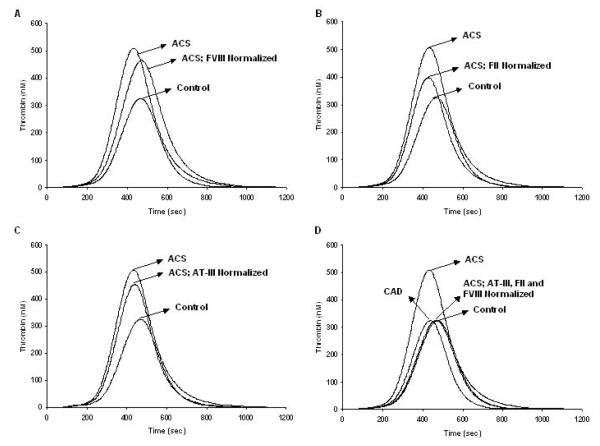
Figure 2. Thrombin generation in acute and stable coronary disease: normalization of the acute population.
Within the acute population, fVIII, prothrombin and AT were normalized by setting their factor levels to mean physiologic concentration (fVIII: 0.7nM (panel A), prothrombin: 1.4μM (panel B), AT: 3.4μM (panel C)). The normalized thrombin generation profile from the acute group is compared to the control (all factor levels at mean physiologic concentration). Panel D shows the thrombin generation output when all three factors (fVIII, prothrombin and AT) are normalized together and compared to the control and the stable group[36].

