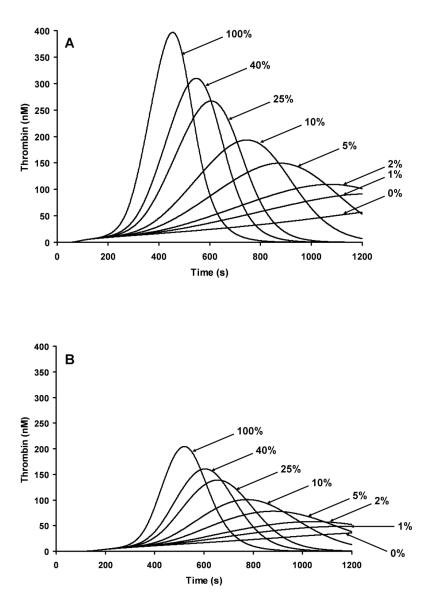
Figure 3. Factor VIII titration using numerical simulations at a 5pM Tf stimulus.
A fVIII titration of 0, 1, 2, 5, 10, 25, 40 and 100% fVIII are illustrated for individuals having their other factor levels (fII, fV, fVII, fIX, fX, AT and TFPI) set to the high range of normal (Panel A) or to the low range of normal (Panel B).

