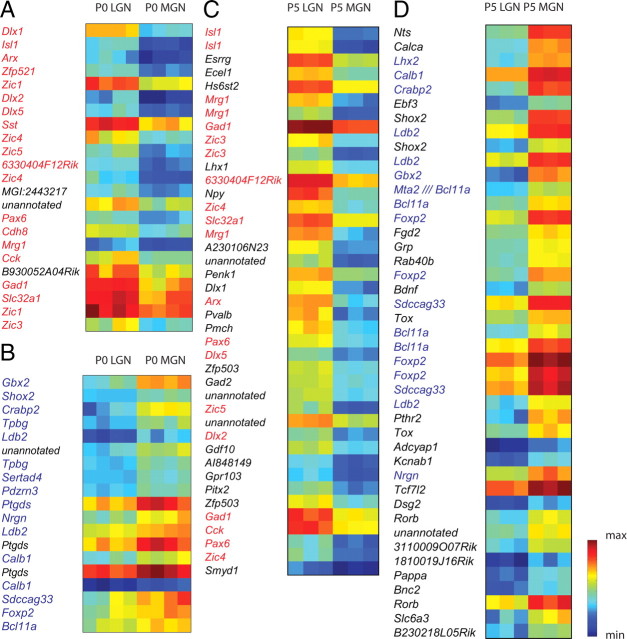
Figure 2.
SAM identifies LGN- and MGN-enriched groups at P0 and P5. A, B, A group of 20 unique genes enriched in P0 LGN (A) and a group of 13 unique genes enriched in P0 MGN (B), determined in SAM using a fold change (FC) >2 and a delta value adjustment to 0.831 to yield a FDR < 0.01%. Seventeen of twenty (85%) of the P0 LGN genes (red type) were present in the P5 LGN group using the same SAM criteria and twelve of thirteen (92%) of the P0 MGN genes (blue type) were present in the P5 MGN group. Each P0 group has four replicates with n = 15–20 each. C, Thirty-one unique genes were enriched in P5 LGN with FC >3, delta = 1.4 for FDR <0.01%. Thirteen of thirty (43%) of these genes were present in the P0 LGN set (red type). D, Thirty unique genes were enriched in P5 MGN with these criteria; 10/30 (33.3%) were present in the P0 MGN set (blue type). Each P5 group has three replicates with n = 15–20 each. All genes are ranked by SAM d-score. Color bar, Blue represents minimum intensity value within the gene group on the microarray; red represents maximum intensity.

