Figure 6.
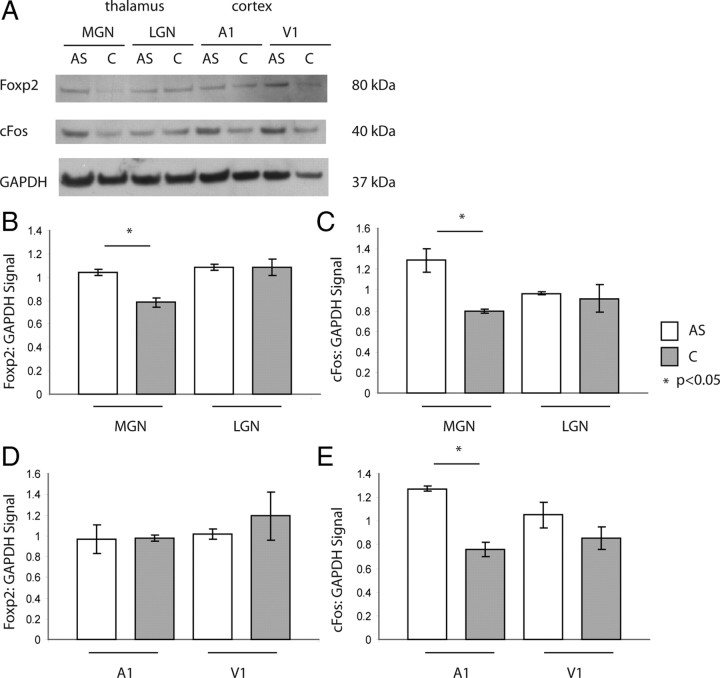
Activity-dependent expression of Foxp2 protein in the auditory thalamus. A, Western blotting of Foxp2, cFos, and GAPDH in the MGN, LGN, A1, and V1 of P18 mice exposed to 2 h of ramped, high-decibel white noise versus no treatment. AS, Auditory stimulation, C, control. B, C, Quantitated signal of Foxp2 (B) and cFos (C) normalized to GAPDH levels shows an increase in Foxp2 expression in the MGN, but not LGN of mice undergoing auditory stimulation (Foxp2 MGN: 1.04 ± 0.025 vs 0.78 ± 0.037, p < 0.05, n = 4 pooled for each group, technical replicate n = 3 for each group; cFos MGN: 1.29 ± 0.02 vs 0.78 ± 0.02, p < 0.05). D, E, In the cortex, Foxp2 levels do not change in response to auditory stimulation (Foxp2 A1: 0.967 ± 0.14 vs 0.977 ± 0.03, p = 0.585; Foxp2 V1: 1.01 ± 0.048 vs 1.19 ± 0.232, p = 0.54), while cFos levels increase in both A1 and to a lesser extent, V1, of stimulated mice (A1: 1.27 ± 0.025 vs 0.76 ± 0.059, p < 0.05; cFos V1: 1.05 ± 0.108 vs 0.85 ± 0.096, p = 0.786).

