
Figure 7.
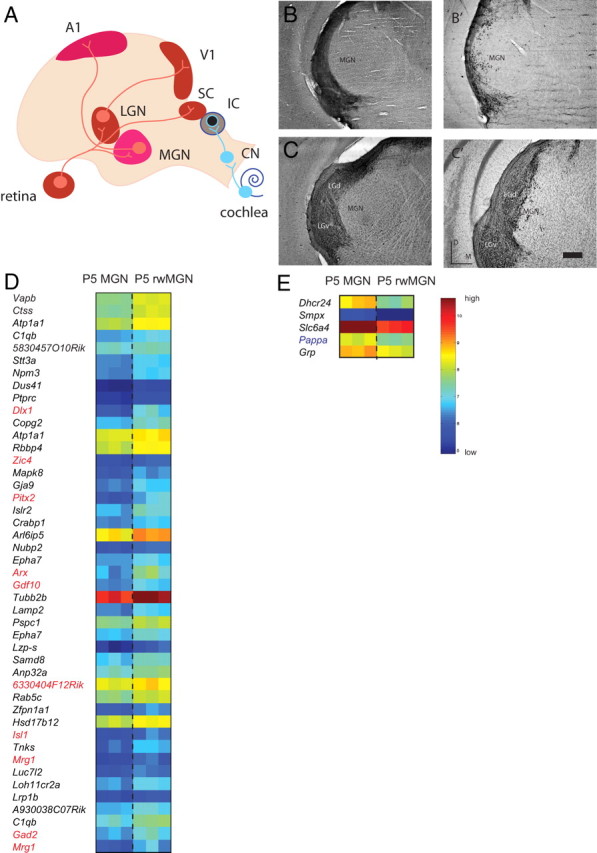
SAM identifies both novel and LGN-like patterns of gene expression in rwMGN at P5. A, Schematic of the rewired auditory pathway after IC ablation. MGN receives novel inputs from the retina, which drive the MGN and A1 to mediate visually driven responses. B, C, Intraocular injections of CTB project to the thalamus in normal (B, C) and visually rewired (B′, C′) mice. Coronal sections demonstrate ectopic retinogeniculate terminals in the rewired MGN (B′, C′) but not the normal MGN (B, C). D, Forty-four probes, corresponding to 41 unique genes, are enriched in the P5 rwMGN with a fold change (FC) >1.5 and false discovery rate <3.37% (n = 15–20 per replicate, 3 replicates per group, delta value = 0.666), and 10/41 (24.4%) of these enriched genes were present in the P5 LGN-enriched set (red type). E, Five probes, corresponding to five unique genes, were downregulated in the rwMGN, and only one was a gene enriched in the P5 MGN (blue type). Each group has three replicates with n = 15–20 each. All gene sets are ranked by SAM d-score. Color bar, Blue represents minimum intensity value within the gene set on the microarray; red represents maximum intensity.