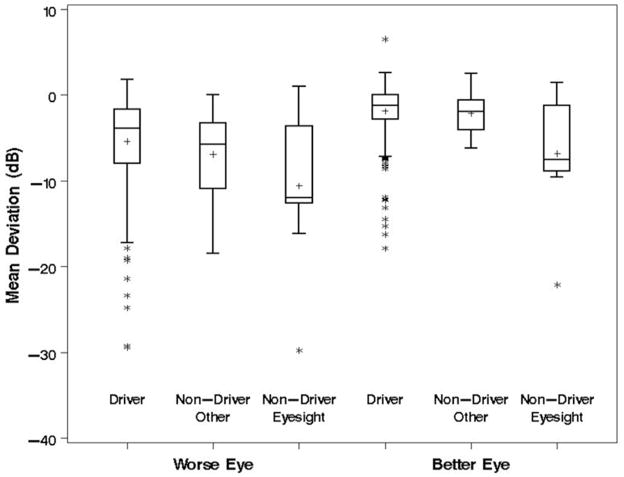
Figure 5.
Boxplot showing the distribution of mean deviation values at 54 months by National Eye Institute- Visual Function Questionnaire driving status. Boxes extend from the 25th to 75th percentile. The crossbar is at the median, and the “+” sign indicates the mean. Whiskers extend to the nearest point within 1.5 times the interquartile range. Points beyond whiskers are indicated as outliers

