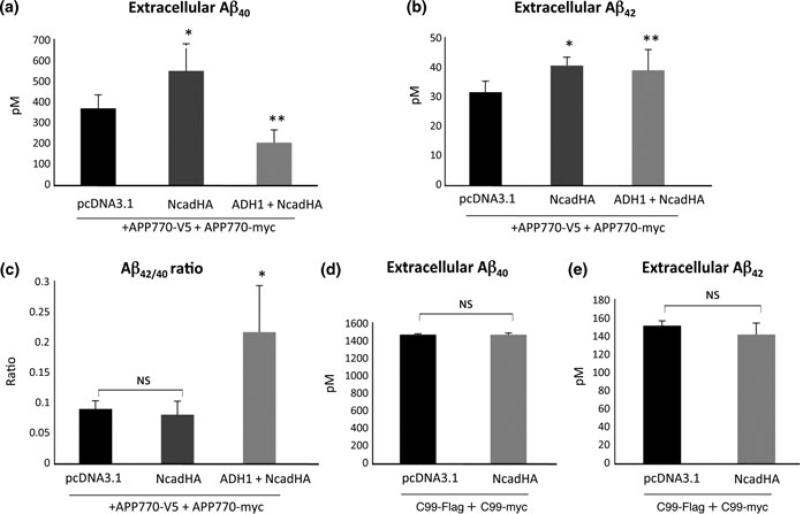
Fig. 6.
Effects of N-cadherin expression on Aβ production. (a,b) Both Aβ40 and Aβ42 are increased under the expression of full-length N-cadherin, compared with the expression of empty vector (pcDNA3.1) (a,b: *p < 0.01, n = 6). Treatment of ADH-1 to N-cadherin expressing cells significantly reduced Aβ40 production (a: **p < 0.01, n = 6), whereas production of Aβ42 was increased compared to control (b: **p < 0.05, n = 6). (c) The Ab42/40 ratio was significantly higher in the cells treated with ADH-1 (*p < 0.001, n = 6). (d,e) HEK293 cells were co-transfected with C99-Flag and C99-myc with or without NcadHA. The production of Aβ40 as well as Aβ42 was almost identical between each condition.

