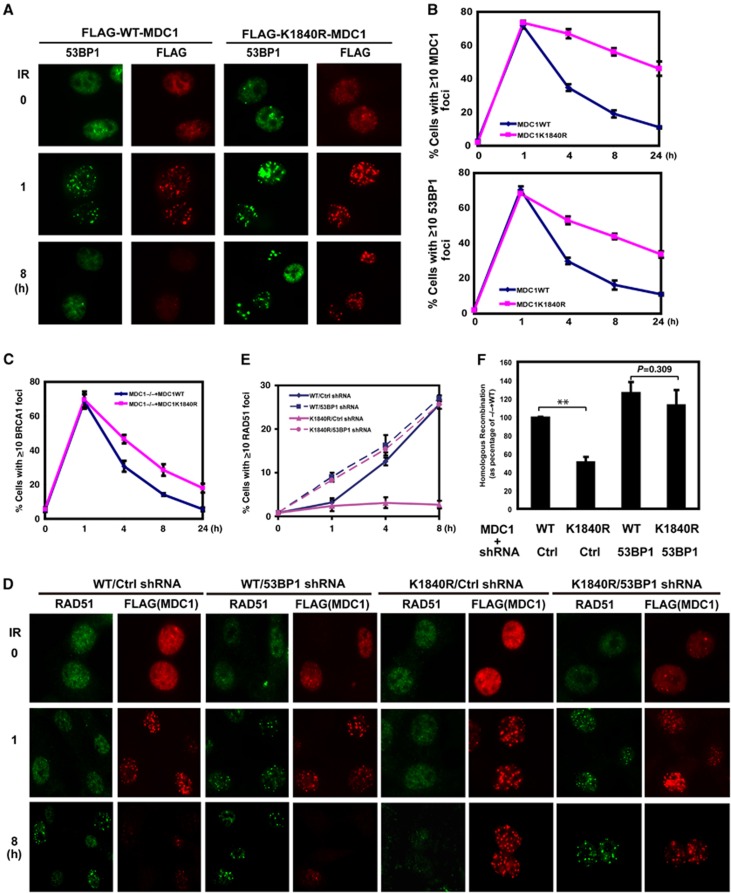
Figure 7.
Downregulation of 53BP1 rescued Rad51 foci and HR in cells expressing MDC1K1840R. (A) MDC1−/− MEFs reconstituted with FLAG-WT MDC1 or K1840R MDC1 were left untreated or treated with IR (2 Gy). The formation of MDC1 and 53BP1 foci was then examined by immunofluorescence at indicated time points. (B) Quantification of the percentage of cells displaying MDC1 or 53BP1 foci. Each line represents three independent experiments. Error bars represent s.e.m. from three independent experiments. (C) MDC1−/− MEFs reconstituted with WT or K1840R FLAG-MDC1 were treated with or without IR (2 Gy). The formation of MDC1 and BRCA1 foci was then examined by immunofluorescence at indicated time points. Quantification of the percentage of cells displaying BRCA1 foci is shown. Error bars represent s.e.m. from three independent experiments. (D, E) MDC1−/− MEFs reconstituted with WT or K1840R FLAG-MDC1 were infected with Ctrl or 53BP1 shRNA. Cells were treated with IR (2 Gy), the formation of Rad51 and MDC1 foci was examined at indicated time points. Representative images are shown in (D), the quantification of the percentage of cells displaying Rad51 foci is shown in (E). Error bars represent s.e.m. from three independent experiments. (F) MEF cells as indicated were subjected to HR assay. Error bars represent s.e.m. from three independent experiments. **P<0.01 two-tailed Student’s t-test.

