
Figure 1. ZNF703 is a target gene of the 8p12 amplification in luminal B breast tumours.
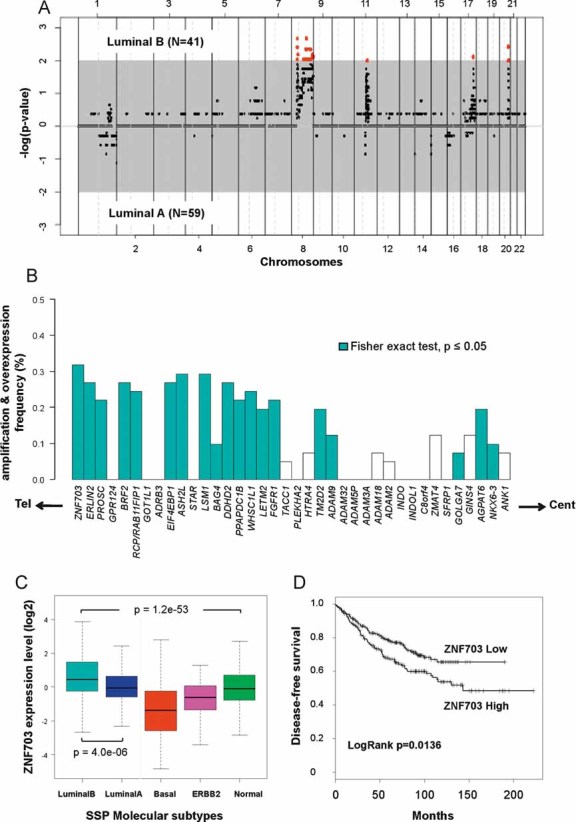
- Supervised analyses of aCGH data comparing amplifications in 41 luminal B tumours and 59 luminal A tumours. Genomic segments are ordered on the X-axis from chromosome 1 to 22 and on the Y-axis according to their association with luminal A or B molecular subtype (−log(p-value)). The grey zone contains genomic segments that are not significantly associated with any of the two molecular subtypes (p > 0.01). Red dots represent genomic segments significantly amplified in luminal B breast tumours (p < 0.01). These segments are contained in 8p12, 8q22, 11q13, 17q24, and 20q13 chromosomal regions. We did not identify genomic segments significantly amplified in luminal A tumours.
- Combined genomic and transcriptional analysis for each gene from the 8p12 amplicon identified in luminal B breast tumours. Genes are ordered from telomere (left) to centromere (right) and the frequency of luminal B tumours presenting an increase in gene copy number and mRNA level is represented. Blue bars label genes that present a statistically significant association between gene amplification and overexpression (Fisher's exact test, p-value ≤ 0.05).
- Box-plot representing ZNF703 expression distribution according to molecular subtypes of 1172 breast tumours. ZNF703 expression varies across the five molecular subtypes (ANOVA, p = 1.2 × 10−53) and is higher in luminal B tumours compared to luminal A tumours (t-test, p = 4 × 10⁻⁶).
- Kaplan–Meier survival curves according to ZNF703 gene expression status. ZNF703 gene expression is associated with DFS (p = 0.0136).