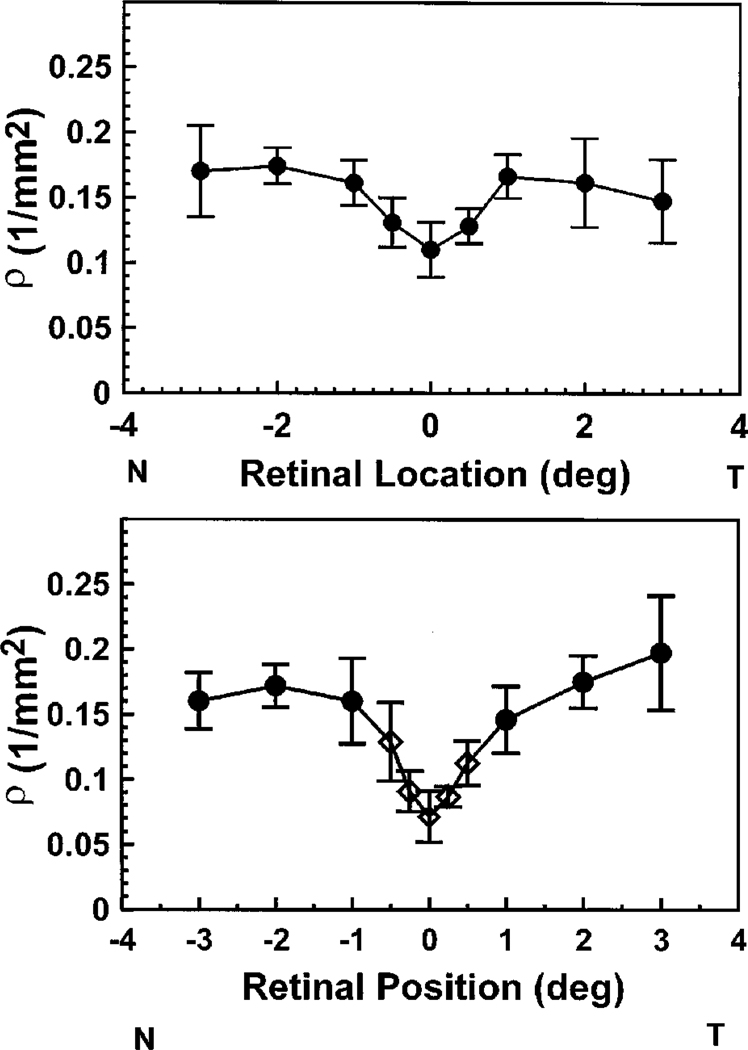
Fig. 2.
Best fitting ρ values as a function of retinal location. The measurement field size was 1 deg in diameter. Top, mean ±2 standard errors of the mean for a single subject. Data were collected in four separate measurement sessions over four months. Bottom, average results for five subjects. Error bars represent ±2 standard errors of the mean. Circles, values collected with a 1-deg-diameter illumination spot; diamonds, measurements made with a 0.5-deg spot.

