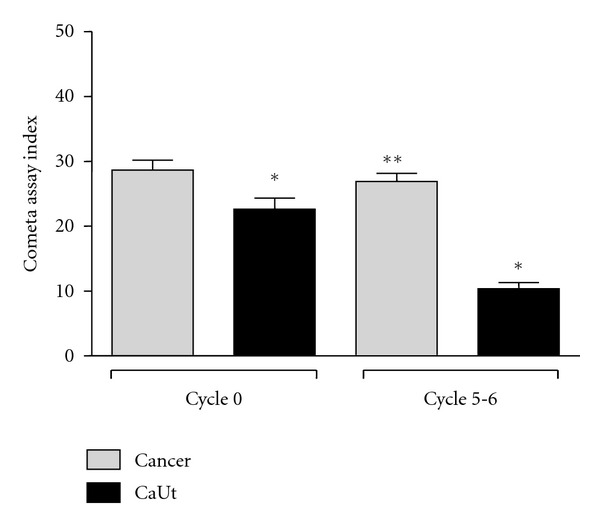
Figure 2.

Index test of blood cells in patients with breast cancer treated and not treated with Ut. *Represents significant difference between all groups (P < 0.05). **Represents significant difference between the UtCa group (cycle 0) and the UtCa group (cycle 5-6) P < 0.05 (Student's t-test).
