
Figure 3.
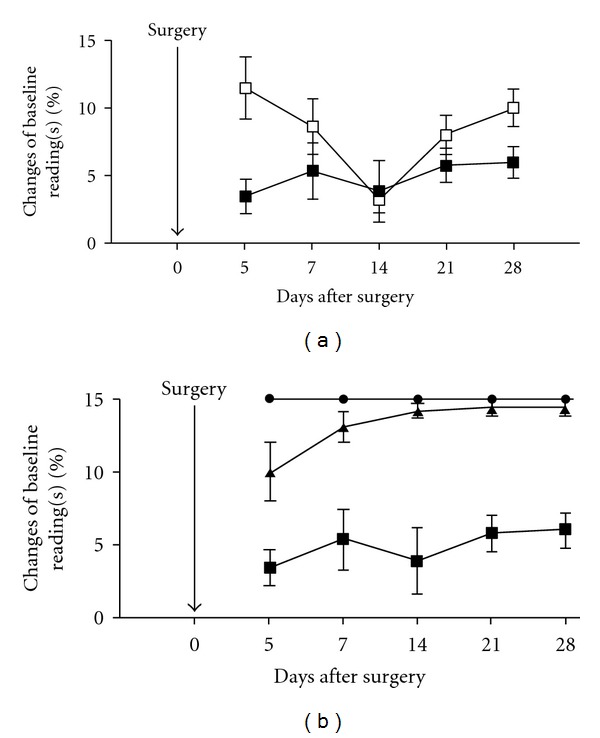
(a) von Frey data comparing tactile threshold between ipsilateral foot (■) with the contralateral foot (□) in animals after facet joint compression on day 5, 7, 14, 21, and 28. (b) Comparison of tactile sensitivity in the three groups: naïve (•; n = 6), sham (▲; n = 6) and model (■; n = 6) animals. The model animals showed a statistically significant difference from the sham and the naïve animals on all test days (P < 0.001).