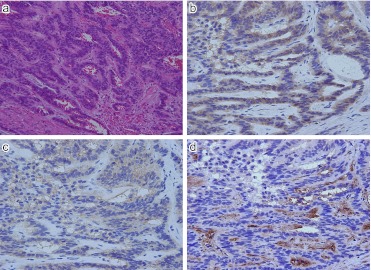
Fig. 6.
Expression of SSTR-1, 2 and 3 in NET G1 (carcinoid tumor) of rectum. a) H-E; Ribbon-likearrangement of relatively uniform tumor cells. b) SSTR-1; Diffuse cytoplasmic positive staining in tumor cells. c) SSTR-2; Membranous and/or cytoplasmic localization seen. d) SSTR-3; Cytoplasmic staining identified in tumor cells. Positive staining present in some interstitial cells. Original magnification ×200 (a), ×400 (b–d).

