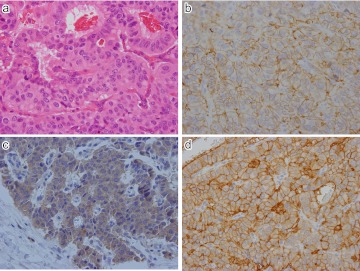
Fig. 7.
Expression of SSTR-1 and 2 in NET G2 (atypical carcinoid) of stomach. a) Ribbon-like arrangement of tumor cells of nuclear atypia. b) CD56; Intense membranous staining seen along the plasma membrane. c) SSTR-1; Mostly cytoplasmic positivity in tumor cells. d) SSTR-2; Intense membranous staining along the plasma membrane of tumor cells. Original magnification ×400 (a–d).

