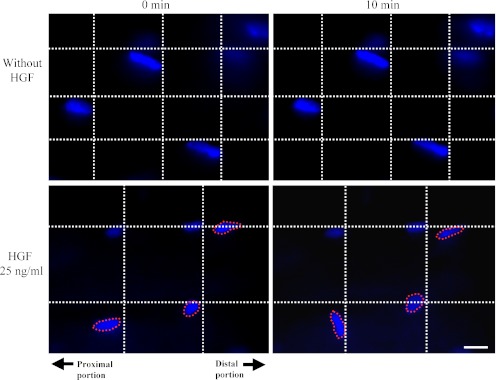
Fig. 2.
Photomicrographs showing exogenous HGF-triggered cell migration in intact soleus muscles. The localizations of the nuclei in the intact soleus muscles without HGF treatment (upper panels) and with 25 ng/ml HGF (lower panels) are shown. The left and right panels indicate the localizations of nuclei after 0 and 10 min, respectively. The nuclei surrounded by a broken line indicate the migrating cells. In each panel, the right and left sides indicate the distal and proximal portions of the intact soleus muscle, respectively. Bar=10 µm.

