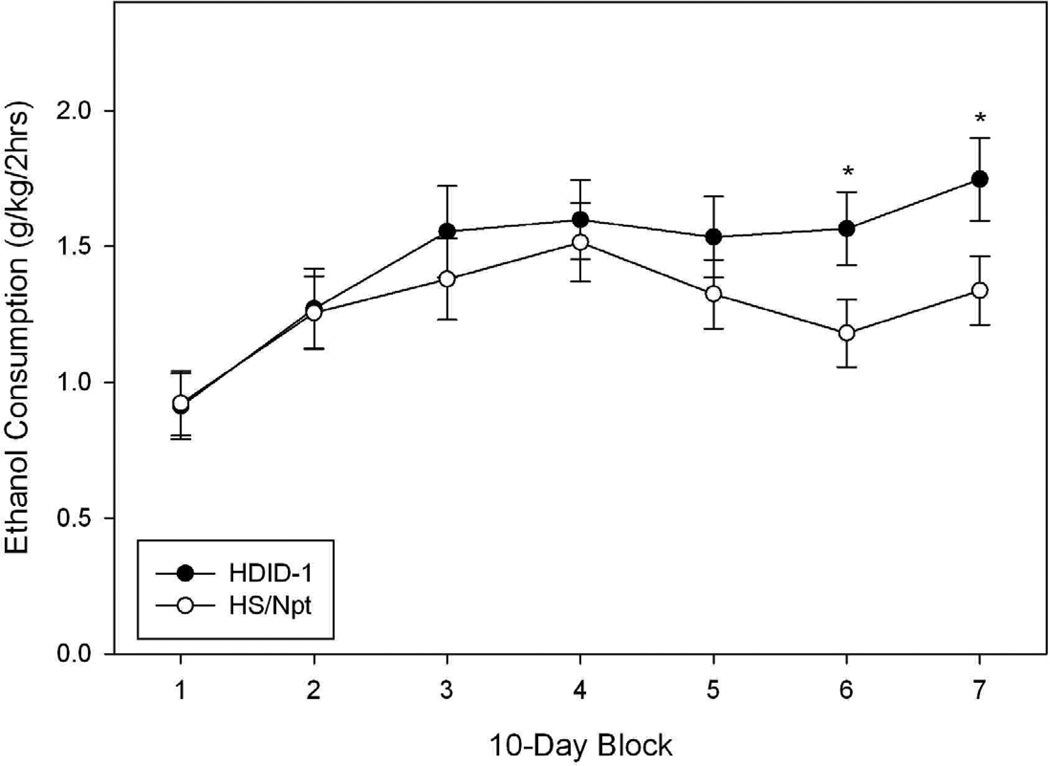
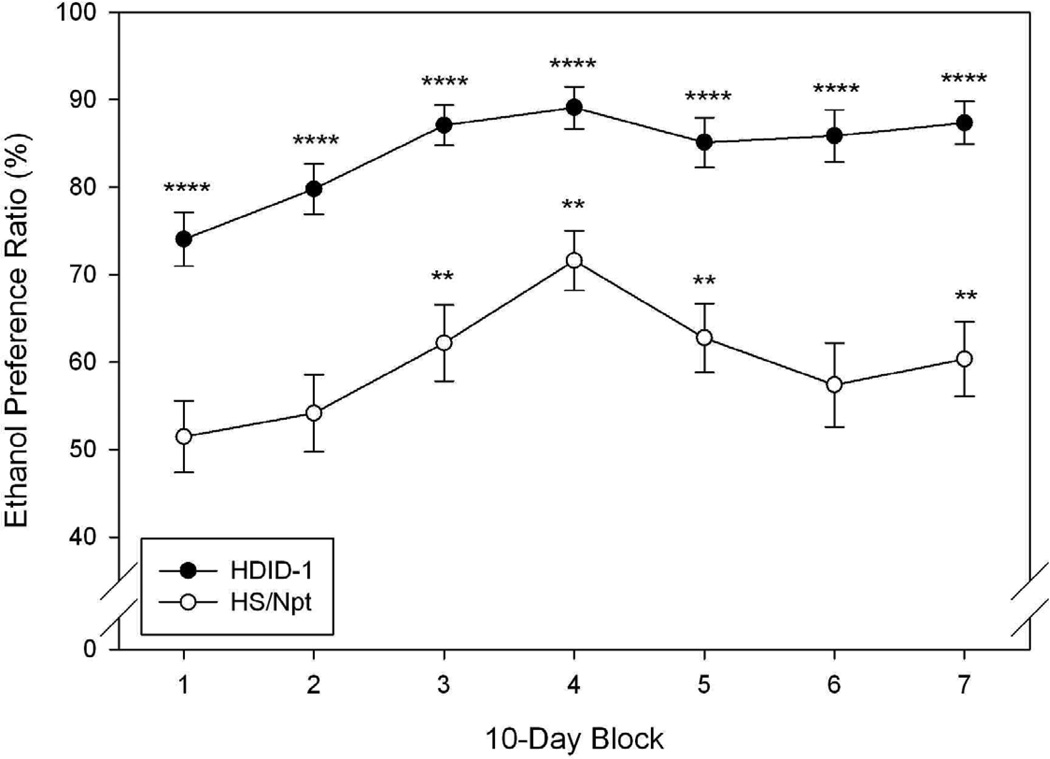
Figure 4.
Limited access (2 hr), two bottle choice ethanol consumption (A) and preference ratio (B) in HDID-1 vs HS/Npt female mice. A: Mean ± standard error of the mean (S.E.M.) daily consumption (Y-axis, g/kg/2hrs) of 15% ethanol over a 68-day period (averaged over 9–10 day blocks, X-axis) is shown. HDID-1 = High Drinking in the Dark-replicate 1; HS/Npt = heterogeneous stock. * Significant difference between genotypes (P < 0.05). B: Mean ± S.E.M. daily ethanol preference (Y-axis, calculated as the ratio of ethanol (mls)/total fluid consumption (mls)) over blocks (X-axis). Significant preference for ethanol (**, |ts| > 2.4, P ≤ 0.01; ***, |ts| > 7.84, P <0.0001). The HDID-1 ethanol preference ratios were significantly greater than those of HS/Npt (Fs > 17.5, Ps ≤ 0.0001).


