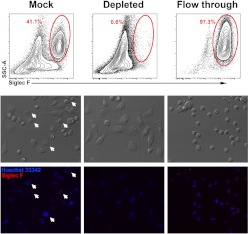
Figure 3. Eosinophil depletion from thioglycollate-elicited peritoneal cells.
(Upper row) Flow cytometric analysis of eosinophil content of freshly isolated peritoneal cells in the mock-depleted (left), depleted (middle), and flow-through (right) fractions. Contour plots show cells after gating on live/singlets (as shown in Fig. 1A). Numbers on the contour plots represent percentages of the parent population. (Middle row) Phase-contrast photomicrograph of cultured peritoneal cells. (Bottom row) Immunofluorescent photomicrographs of the corresponding phase-contrast images. Siglec F-PE staining is shown in red; nuclei are stained in blue with Hoechst 33342. Arrows indicate eosinophils.

