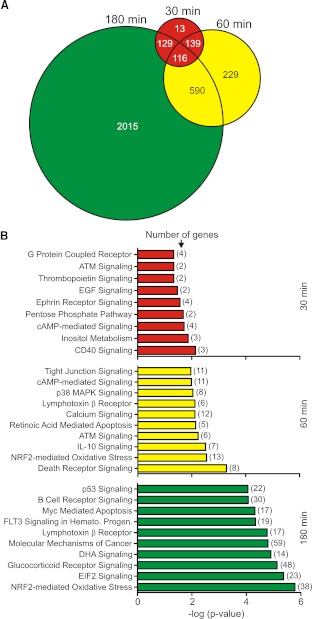
Figure 7. PVL causes global changes in PMN gene expression.
PMNs (1×10⁷) were cultured with 1 nM native PVL or iPVL, and changes in transcript levels between the two conditions were measured using Affymetrix HU133 + two GeneChips, as described in Materials and Methods. (A) Venn diagram depicting the total number of differentially expressed genes (i.e., as a result of exposure to PVL) at each time-point. (B) PMN signal transduction pathways represented by differentially expressed genes after cells were exposed to PVL. Pathways or processes were identified using Ingenuity Pathway Analysis, as described in Materials and Methods. The P value indicates the likelihood that genes are associated with a given pathway or process because of random chance. ATM, ataxia telangiectasia mutated; NRF2, NF-E2-related factor 2; FLT3, fms-like tyrosine-kinase 3; Hemato. Progen., hematopoietic progenitors; DHA, docosahexaenoic acid; EIF2, eukaryotic translation initiation factor 2.

