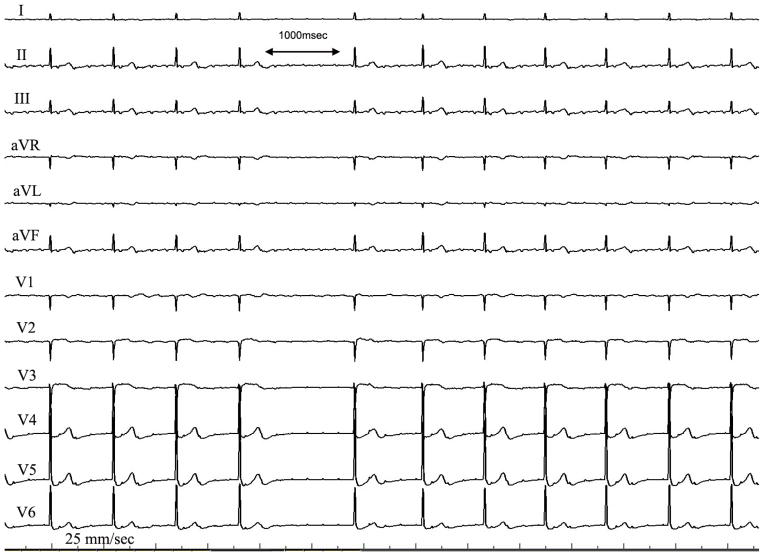
Figure 2.
12 lead ECG of the unusual pattern seen in CTI flutter. Note the diffuse low amplitude flutter waves seen in most leads, but especially prominent in leads I, V5/6. The ECG is recorded at 25 mm/sec with a 1 mV/cm voltage. Note that the low amplitude tracing may mimic that of atrial fibrillation.

