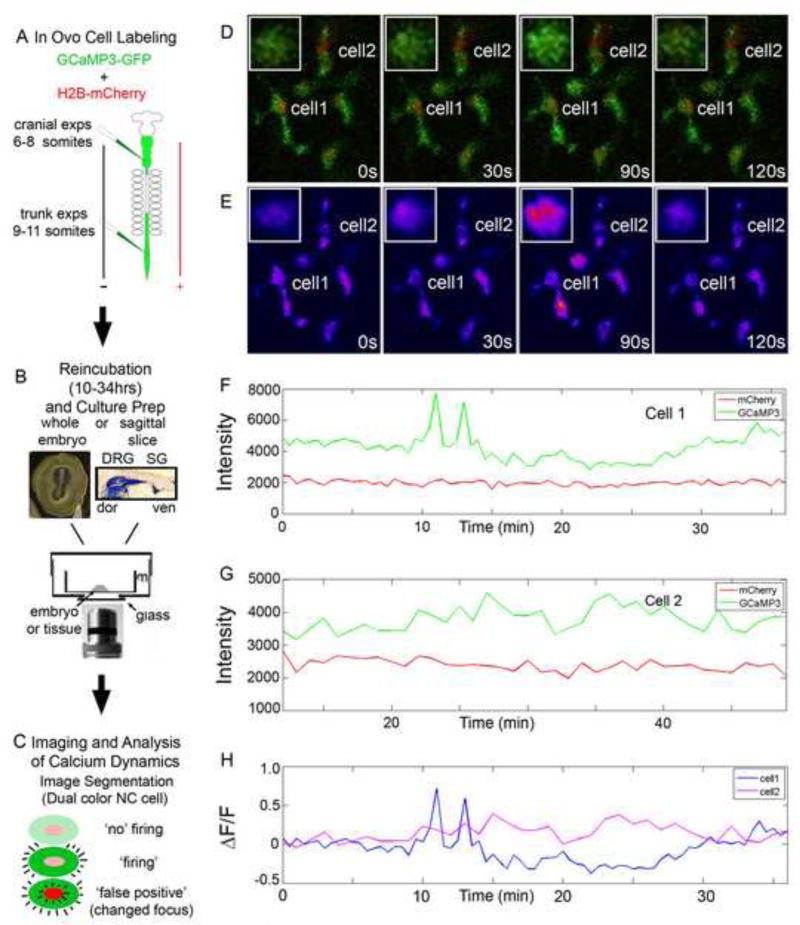
Figure 1. In vivo confocal time-lapse of GCaMP3 labeled NC cells.
A) Embryos were labeled by injection of a cocktail of DNA constructs into the neural tube and electroporation to label the premigratory NC cells. 6-8 somite embryos were used for cranial NC experiments while 9-11 somite embryos were used for trunk NC experiments. B) Embryos were incubated until the proper stage was reached (10 hours for cranially labeled, up to 34 for trunk). Whole embryos were mounted for cranial measurements while a sagittal section was created and mounted for trunk experiments on a culture insert. C) Confocal time-lapse imaging was performed on samples and the calcium transients were segmented out. The calcium transient was verified by constant mCherry fluorescence intensity. D) Selected images from a time-lapse imaging session of NC cells in the forming SG. Inset: magnified image of Cell 1. E) Heat map display of GCaMP3 intensity of same images as in D. F and G) Intensity plots of Cell1 and 2 in both GCaMP3 and mCherry channels showing the difference between a cell with a calcium transient and a neighboring cell without a calcium transient. H) ΔF/F0 for Cell 1 and 2 calculated from the intensity plots in F and G.

