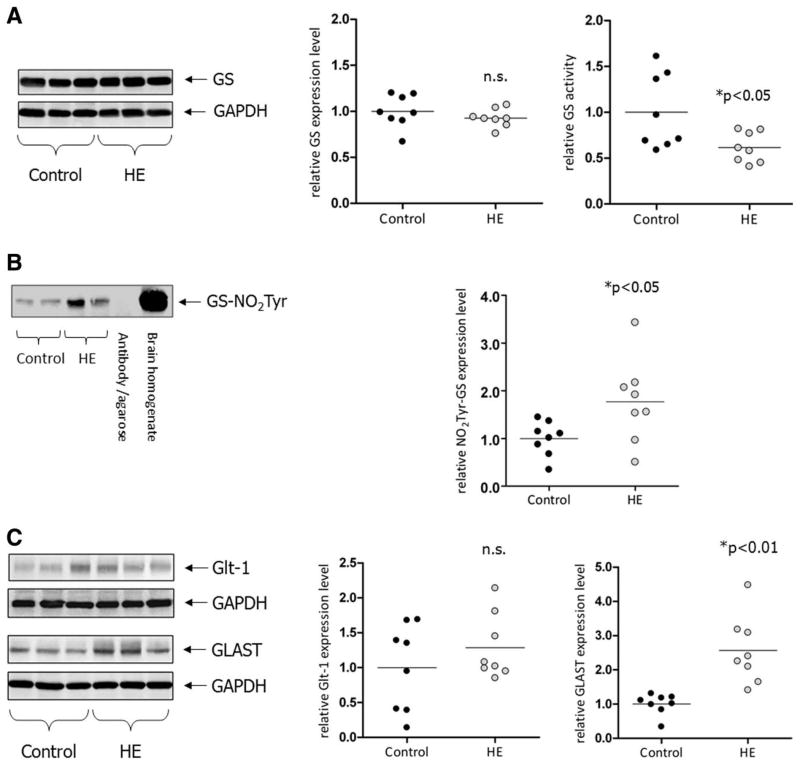
Fig. 4.
(A) Glutamine synthetase and glutamate transporter expression in cerebral cortex from control patients and patients with cirrhosis and HE. Protein lysates prepared from the cerebral cortex were analyzed by western blot analysis for expression of GS at the level of GS protein and enzymatic activity. Expression of GS protein is given relative to GAPDH expression. GS activity was measured as described in Patients and Methods. *Significantly different compared with the control group. n.s., not significant. (B) Detection of tyrosine-nitrated GS in cerebro-cortical protein lysates. Anti-3′-nitrotyrosine immunoprecipitates were analyzed by western blot analysis for the presence of GS (GS-NO2Tyr). As for control, precipitation was performed without addition of protein lysate (antibody/agarose control). Total lysate from human brain served as a positive control for detection of GS. Expression levels were quantified densitometrically and are shown separately for each case on the vertical scatter plot; bars represent the mean values. *Significantly different compared with the control group. (C) Protein lysates were prepared from the cerebral cortex and analyzed by western blot analysis for expression of GLAST and Glt-1. Expression of transporter proteins is given relative to GAPDH expression. Western blots from three representative control and HE patients are shown. GAPDH served as a loading control. Expression levels were quantified densitometrically and are shown separately for each case on the vertical scatter plot; bars represent the mean values. *Significantly different compared with the control group.

