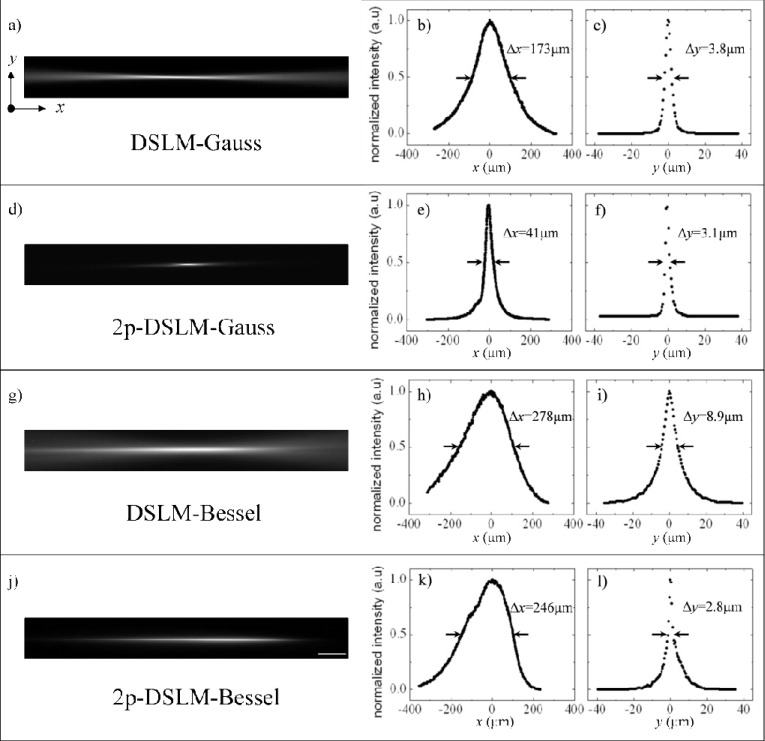
Figure 2.
Normalized fluorescence images and intensity profiles along x and y for the different excitation beams: a-c) DSLM with Gaussian beams, d-f) 2p-DSLM with Gaussian beams, g-i) DSLM with BB and j-l) 2p-DSLM with BB. The FWHM widths are indicated between arrows for each modality and their corresponding values Δx and Δy are included. These values are also summarized in Table 1. Profiles were taken along x and y directions with the point of maximum intensity located at the origin of coordinates, see the reference axes in Fig. 1(a). Scale bar: 50 μm, a pixel of the image corresponds to 0.44 μm in the sample.

